


We have yet to see the full text of all the motions to be debated at Spring Conference in York, but it appears that this motion on economic policy has been selected.
There is much in the motion I agree with, and some places where I think it is lacking, but it was this line in particular that caught my attention, in the “conference notes…” section:
growing inequalities in wealth and income, coupled with unfair and regressive action against the poorest people in the country, now exacerbated by the assault on welfare spending.
It struck me because the most recent analyses of income inequality in the UK that I have recently read have concluded that the trend since the early 1990s is of broadly stable levels of income inequality, with falling levels after the financial crash of 2008/9.
John Rentoul, chief political commentator for the Independent on Sunday, has written about this a lot over the last few years, and concludes that the evidence “runs so counter to what everyone thinks they know”.
So what is that evidence?
There appear to be four reliable indicators of income inequality (all discussed by Rentoul here):
- The share of household income held by the top 1% of individuals.
- The Gini coefficient.
- The ratio of incomes at the selected percentiles.
- The mean log deviation (pdf).
Whilst there are some differences between all of these measurements, the general trend appears to be the same: big increases in inequality during the 1980s, a flattening off in the 1990s, broadly stable levels of inequality until around 2008, and falling inequality since.
 Let’s look at the data a little more closely, starting with one of the longest-standing measures of inequality: the Gini coefficient, which, as John Rentoul explains, is:
a number that measures disparities in income: 100 percent means one person has all the money, 0 percent means everyone has the same amount of money.
The chart above shows the Gini coefficient of income in the UK since 1977 (the latest available data seems to be 2012/13), and the broad trend discussed above is clear: a significant increase in inequality in the 1980s, broad stability since and a fall coinciding with the last recession.
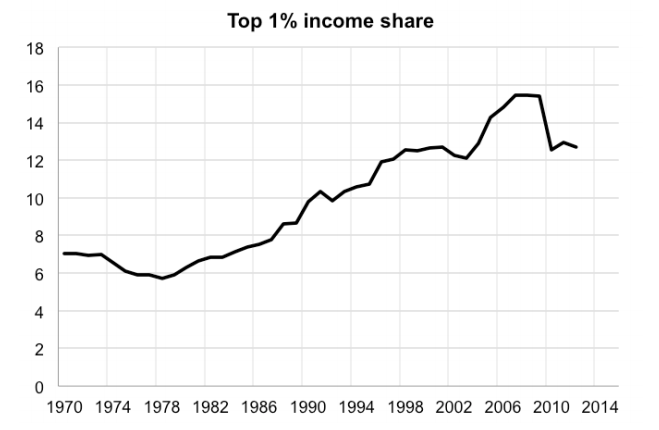 Let’s next look at the share of household income held by the top 1% of earners. Here, the trend is rather different, with a steady increase in the share of income held by the top 1% from the late 1970s onwards. Until, that is, we reach the 2008/9 recession, where we see a relatively large drop (see chart).
So whilst this picture doesn’t fit the general trend, neither does it support the contention of growing income inequality.
Another way to measure income inequality is to choose two percentiles of income and compare them. This chart shows the ratio at the 90th and 10th percentiles, and the picture is very similar to that painted by the Gini coefficient.
 However, this method can also be useful to show differences in inequality growth rates among those with more similar incomes, as demonstrated in the chart to the right. What this appears to show is relative stability in inequality rates at middle and low incomes, but a much bigger divergence between the top 1% of earners and the top 10%. Again, though, this trend is broken by the recession.
Finally, there is a measure called the mean log deviation, used by the Institute for Fiscal Studies. As can be seen on the graph at the foot of the page here, however, this maps very closely the Gini coefficient.
In short, then, I can’t find any evidence to support the motion’s assertion that income inequality in the UK is growing; indeed, on many measures the recent trend seems to have been one of falling levels of inequality. I’d be interested to see if any readers can find anything to the contrary.
(I’ve deliberately not dealt with wealth inequality here, because the picture here is, at the very least, more mixed.)
* Nick Thornsby is a day editor at Lib Dem Voice.


36 Comments
It’s difficult to separate wealth and income inequality. The largest incomes are received almost entirely as a result of wealth. The rise in wealth inequality is presumably the reason why income inequality has risen at the top end.
One reason why these results may be counter-intuitive is that they mask the inter-generational re-distribution that was a significant feature of the coalition period. Poor old people have got richer. Poor young people have got poorer.
Good post Nick. If all we are interested is seductive rhetoric then we can just shout about inequality like the Green Party and other anti-capitalists do. But if we are seriously interested in *tackling* inequality then we need to understand the phenomenon properly, and that means understanding where and when it is occurring.
Your are correct that income inequality has not grown recently. It is true that wealth inequality *has* grown, and this is largely due to lax monetary policy globally – $trillions in Q.E. and zero % interest rates have flooded the top-end of the finance system with easy cash, which has fed into the global equity markets and property markets, inflating bubbles of “wealth” (that are illusory, actually).
It may well be that our (wrong) perception of growing wealth inequality is down to modern society, social media presenting us with more wealth than we were used to seeing before. We need to understand this.
That said, even if inequality isn’t growing, it is still too high, and we should be looking at ways to reduce it to levels nearer what it was in the 70s.
*cough* Land value tax *cough*
This is a useful analysis, Nick. Rentoul is right that the evidence “runs so counter to what everyone thinks they know”. It is particularly interesting that:
– income inequality remained flat despite a transition from the Conservatives to Labour
– income inequality remained flat despite a massive increase in government spending after 2001
– income inequality fell even as government spending was slashed after 2010
– a whole raft of government programmes have failed to have any impact on overall inequality levels.
Of course, the decline in the Gini Coefficient after 2008 was not because the poor got richer but because the rich got poorer; I expect that near-future figures will show inequality return to the pre-2007 norm (in which case one could claim that “inequality is rising/” though it would be slightly disingenuous).
There is one caveat to bear in mind, however. The distribution of inequality has definitely changed: if you did more deeply you will find that (for example) “child poverty” (which is in fact a measure of inequality) fell in the 2000s whereas “poverty” (i.e. inequality) among single people without children rose.
I’m sorry, but inequality is growing in the UK. A proper reading of the latest IFS Report confirms this. See link below.
Living Standards, Poverty and Inequality in the UK: 2015
http://www.ifs.org.uk/uploads/publications/comms/R107.pdf
This is confirmed in the report by Credit Suisse which states that the UK is the only G7 country to record rising wealth inequality in 2000-14. Wealth inequality has risen four times faster in the seven years after the crash compared with the seven years before. The rich in the UK are becoming richer faster than ever. Wealth inequality rose under Labour; it rose faster under the coalition.
One area of genuine success for the coalition was employment. Job seekers’ allowance fell in real terms but so did the number of people on it.
A more dubious achievement is the rise in rents and hence in the nominal income of those on housing benefits.
David, where in the publications you quote is the point about income inequality made?
I think you are mistaken, David.
Figure 3.4 on p32 of the IFS report you cite clearly shows that the Gini coefficient was broadly flat (between 0.33 and 0.36) over the period 1989-2013.
To quote from p33: “Taken together, these trends indicate that the last 25 years have seen income inequality fall across most of the distribution.”
However, they do on to note that “the top 1% of individuals have taken an increasing share of total household income. The common perception that inequality is rising may be based on the ‘racing away’ of a small group at the very top of the pile, rather than on trends in inequality across the vast majority of households.”
Nonetheless, this ‘racing away’ by the top 1% does not affect the main measures of inequality (and basing one’s assessment on the one statistic that supports a particular view would be an example of gross confirmation bias).
What I object to in all this, however, is the sense that there is a “share” of the income distribution that is in some way “fair.” If those at the top of the income distribution are increasing their productivity faster than those lower down, it will follow that their incomes will rise more quickly. Nonetheless, everybody in society benefits from their increased productivity.
The richest are not being more productive. Most of their income is from investments and they are probably not getting a better rate of return. They just have more wealth to invest.
Rich people, especially bankers on bonuses and financial fat cats, have been coining it for decades since the 80s. After the 2008 crash, however, there was a blip, as bankers’ bonuses were temporarily much reduced. The banksters have since stopped apologising for anything, and their incomes have resumed a relentless upward march, but the blip in the data is of course still identifiable.
Rich people and their rich accountants and lawyers have lobbied strenuously to exaggerate and magnify the significance of the blip, with the aim of defusing anger, and keeping their excessive wealth out of the hands of anyone else.
Whose side are we on?
Peter Davies
“It’s difficult to separate wealth and income inequality. The largest incomes are received almost entirely as a result of wealth. The rise in wealth inequality is presumably the reason why income inequality has risen at the top end.”
Wealth and Income Inequality are actually not connected in the way you suggest, the massive increase in wealth inequality is mainly the result of low interest rates and QE inflating asset prices (as Mark Wright point out is an illusion).
The highest earners are not likely to be earning their income form investment income. The top 10% would be £79k+pa income, This is the very bottom of the top 10%. Assuming that you could get a 6% return, which would require invested assets of £1.3m that is excluding the need to cover the erosion of capital and can’t include the primary residence.
Wealth in Great Britain is even more unequally divided than income. The richest 10% of households hold 45% of all wealth. The poorest 50%, by contrast, own just 8.7%.6
How Income is Shared : The poorest fifth of society have only 8% of the total income, whereas the top fifth have 40%.
Office of National Statistics 2014.
@Psi. The report shows a big increase in inequality between 90% and 99% and between 99% and 99.9%. The proportion of income from investments rises at each of those points and the proportion of wealth held by people above those points has risen over the period.
It’s a red herring argument. The point is zero hour contracts, high property prices etc means that great chunks of the working and middle classes are having there incomes destabilised.
One other factor that might make society feel less equal is changes to purchasing power of different incomes. I can’t find a comprehensive study of how this has changed over time but mortgage interest (a major concern of upper middle incomes) has fallen while rent (mainly paid in full by lower middle incomes) has risen. That makes a big difference to their relative sense of well-being.
The National income expressed as GDP per person is just about what it was a decade ago in 2005/2006.
But, the social problems we now see are worse than they were then.
That can only be explained by a shift in the distribution of the available income.
Excellent post. We really should have more data and analysis in politics.
Tedious and specious factionalism from the author as usual.
@petermartin2001: “That can only be explained by a shift in the distribution of the available income.”
or a shift in the distribution of costs or a reduction of services the poor depend on.
I have read the article there times now.
Can I confirm that this a thread for liberal thinking democrats?
Peter – that’s an interesting point and I think looking at inequality of disposal income may be instructive on that. Although looking at the Gini coefficient for disposal income, the trend again looks broadly similar to that for overall income. See: http://pearsonblog.campaignserver.co.uk/wp-content/uploads/Gini-coefficients.png
(That was primarily in response to Peter Davies’s comment on purchasing power.)
@Gareth @Ruwan – which bits of the analysis do you think are incorrect ?
Are these ways of measuring income based upon gross or nett income?
If the former, does the Coalition’s scrapping of the 50% tax rate mean that the nett income of the highest earners has increased? In either case, might the last set of figures for e.g. the Gini index, be depressed by the highest earners choosing to defer a large part of their income until the lower income tax rate came into effect?
Also, does the increase in VAT under the Coalition mean that even if income inequality did not increase, inequalities in the “purchasing power” of that income might have done.
@Tom Papworth “I think you are mistaken, David. Figure 3.4 on p32 of the IFS report you cite clearly shows that the Gini coefficient was broadly flat (between 0.33 and 0.36) over the period 1989-2013.”
Strictly speaking, in his post (https://www.libdemvoice.org/is-income-inequality-in-the-uk-growing-49177.html#comment-392639) David referred to inequality in general rather than income inequality in particular.
What about the counterveiling effect of social capital and access to free services? Suppose a poor family lives near a good state school or NHS hospital. How does that affect the measure of their true wealth?
I believe the motion as drafted does not properly address the wealth and income gaps as it does not understand the role of money creation by banks.
Just about every penny of the UK Money Supply (M4) of £2,000 billion is in the form of deposits in banks, and has been created when banks make loans.
The whole of that sum is effectively ‘on loan’ from the banking sector and upon which interest is paid .
This interest of £213bn a year, is collected by the banking sector.
See http://positivemoney.org/issues/inequality/
We need the State to take over the controlled creation of money.
http://positivemoney.org/our-proposals/
Once that becomes a core LibDem drive, we will begin getting somewhere.
but only 3% of this has been created by the State (when minting notes and coins).
The other 97%
This is a good post, thanks Nick. Its seems pretty clear that although the change in income inequality is pretty flat right now, wealth inequality is probably still on the rise.
Couple of points though:
– Although inquality of income might not be getting any worse, we are living in a massively unequal society due to the Thatcherite deregulation, taxation changes and labour reforms of the eighties. We need to be getting back to the ‘normal’ of the 50s, 60’s and 70’s of around 0.2 to 0.3, not the level we’re at now. It can be done, look at the Northern European countries that are all around this level, even with a cursory visit to these countries the sense of social cohesion and togetherness is palpable.
– Living in the UK it *feels* like an unequal society and that probably matters more than any statistic. Telling people the gini coefficient is pretty flat probably won’t make them feel any happier.
So much as I appreciate the analysis fellah, just because the stats may say it isn’t getting any worse its kind of missing the point – we’re still a million miles from where we should be (and were until the disgracefully uneven boom of the 1980’s) to have a cohesive society.
Long standing Liberal policies like Land Value Tax, income tax threshold changes and shifting the burden of tax from labour to wealth would go a huge way to getting us there, and help pay off the deficit at the same time…
I agree with Gareth. Reducing inequality is far more important than measuring it.
James Murray Law.
I tend to agree. The system we have at the moment always seems to increase debt. However the main problem is that Britain does not really have much outside of credit bubbles and the illusion of growth mounting debt creates. On the other if the balance was tipped in the way you suggest then maybe disposable income would be a bigger driver.
I think that concentrating on inequality misses the real point. A pound in your pocket buys exactly the same whether that pound comes from earned income (taxed at 32% above the personal allowance) interest on savings (taxed at 20%) or by making a capital gain (taxed at 18%). We need one single tax on income with a single annual allowance (at least until we choose to implement a Citizen’s income) rather than the mish-mash we have at present. Once we have agreed on a single tax then we can discuss how progressive it should be and what the top rate of tax should be.
The next logical step is to abolish inheritance tax, because it now becomes income for the recipient and is taxed at that point rather than on the estate of the deceased. We also need to reject ideas like Land Value Tax, because anyone getting a return from the land, like farmers, is already taxed. To tax homeowners on the value of the land that their house stands on is nonsensical, because they do not get any return from it until it is sold, at which point it can be taxed as income. In practice, it is only people who are downsizing who are likely to be liable for this. Whether we should return to Schedule A taxation on owner-occupiers to put them on a level playing-field with renters is a reasonable debate to have; I suspect that to make it fair we would have to introduce so many exceptions and rules that it would create new loopholes, but in principle it meets the criterion of putting people on a level playing-field, which I am seeking to do with my single income tax.
Two good reasons strike me for a focus on inequality over absolute poverty:
1. It seems more ambitious. The cause doesn’t go away when people are raised, by whatever means, above some fixed threshold.
2. You can point to the incomes of the rich and say how much good that money would do if more of it went to people who really need it.
However, this approach hits a problem when average and top incomes fall due to a recession. Things then appear to be getting better through falling inequality when really they are just getting worse at all levels.
But so long as the reasons for the focus on inequality are the ones I’ve given – rather than some belief that your good fortune is magically harmful to me – then it is perfectly reasonable to switch focus to absolute measures of poverty until the economy picks up again.
……………………….growing inequalities in wealth and income, coupled with unfair and regressive action against the poorest people in the country, now exacerbated by the assault on welfare spending……………………
I believe ‘inequality’ is missing the point…It’s true that a “pound is a pound” no matter where it comes from but the problem for the poorest is just that they don’t have enough pounds (and the current government appear to be aiming to reduce even that)…
It always strikes me as strange, that the higher up the ladder you go the more ‘carrot’ is required to get better performance, whilst for those at the bottom the only incentive is the ‘stick’….
Thankfully, opposition in the Lords has slowed some of the ‘stick’ and Osborne’s extra £23 billion in ‘faerie gold’ provided a fig leaf for his embarrassing, if welcome, u-turn…However, like all such ‘gold’, it appears transitory and the current UK and world slow down will require a rethink….
More state income is required and that can only come from those, be they corporations or persons, who have it…
What has this article got to do with Liberalism ? Never mind what people experience or the reality of the situation, Nick Thornbys got a couple of fancy graphs.
Like Camerons boast that the rich are paying a greater share of tax, you have to ask why they choose this statistic, instead of the one showing what percentage of their income they pay in tax. So what does it matter if the top 1% get 12% of all income or 11% of an even higher income? Put it in real cash terms and we can al work out if we’d rather have a £10,000 income increased by 10% (£1000) or a £1,000,000 income increased by 1% (£10,000) but with the Nick Thornby neo-con economics, the poor are closing the wealth gap, their earning are rising 10 times faster than the rich. yeah, right.
What’s most impressive about this is the provision of actual evidence for his points by the authors, and completely evidence-free mudslinging from such individuals as Gareth Epps, Caracatus and Peter Davies.
@ Tim Oliver
Hear, hear. Never let a tiny thing like evidence get in the way of a political argument, eh?
Some people like to start with a point of view and arrange the facts around that at will. Some even go as far as to attack the facts themselves as “fancy graphs” just because they conflict with their established, usually anecdotal, world outlook. If the facts change, why do some people not have the intellectual honesty and courage to change their view?
@Caracatus
“What has this article got to do with Liberalism ?”
Because truth is important and Liberals are more interested in it than Socialists or Conservatives.