


At their party conference, Labour were distributing various nationally produced full colour leaflets for local use. One of them – about crime – includes a bar chart.
“Ah,” I hear some of you say, “but how can a national leaflet contain an accurate and reasonable bar chart for use locally?”
“Oh, that’s easy,” I hear some of you say, “it’d be a national bar chart, won’t it? Perhaps the number of MPs in Parliament? That would be same wherever the leaflet goes out.”
Well – that would be a decent excuse. Except that here’s the bar chart which the leaflet contains:
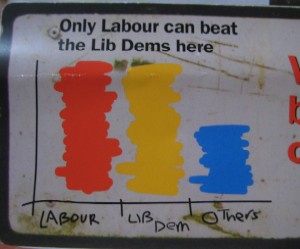
Doesn’t look like a national set of figures somehow does it? In other words, they’d be – to use the technical term – “made up”.
And now, doubtless, cue the comments from Labour hacks ignoring any of the this evidence and instead saying, “oh, but you can’t criticise us, how dare you, you’re so awful you know, and we’re all quite wonderful, you’re just awful, awful, awful”.


15 Comments
This is hilarious. I have seen so many bogus Lib Dem bar charts that any protest on this – partcularly ahead of seeing which if any doors it goes through – really ought to include a shame faced renunciation of your own party’s long established practices.
Not going to do that? Why ever not?
If we are asked to distribute such things here in Manchester I will blog about it. And your indignant cries of protest will form a good part of that story.
Thanks for the admission that the barchart is a complete fake Chris (after all, you’ve not provided any defence for it have you?). Most kind. Nice touch of irony too in exactly following my prediction 🙂
Well this really is the end for bar-charts. With Mark regularly lambasting Labour and Tory ones on LDV and now this new threat for Lib Dem bar charts to feature on Chris’s blog, campaigners nationwide must be terrified that their leaflets will be ridiculed within the blogosphere, damaging their credibility…
But surely that is an excellent bar chart, from the Lib Dem point of view.
Labour is saying that it is a straight fight between Lib Dem and Labour, with the Tories out of the running.
So where are the poor old Tory voters going to turn, in order to make their vote effective?
Labour must be assuming that they can get “law’n’order” Tories to switch directly.
Surely this story is a wind-up?! Actually, when you’ve got the union/hinduja party on the one side, and the Lord Sleeze of Belize pouring his dosh into the Camorons on t’other, a few dodgy bar charts are pretty tame stuff really…
Mark: Irony is great, yes. But whether there is a “fake” bar chart or not depends on what doors it goes through with what words attached.
The one you’ve shown would be pretty close to the parliamentary result in Man Wit for example.
But Lib Dems have been using it (the 2005 result) in ward seats where they have TWICE as many votes as us. 1000 majorities. That’s deeply dishonest.
Let’s see where it turns up and what words go with it. Then we’ll know if it’s proper fake or not.
Kevin: I am offering to blog any Labour bar chart which is misleading. Lib Dem Bar Chart Misleading really is Dog Bites Man so we don’t bother with that too much.
Frankly, anyone who uses dodgy bar charts is dishonest.
“Frankly, anyone who uses dodgy bar charts is dishonest.”
I’ve always taken the view that a bar chart which includes the figures and identifies the source of those figures can’t really be called dishonest. EG:
Hodge Hill
http://tinyurl.com/2srtjo
(A different election to the by-election but identified as so)
What has become more prevalent around the party looking at recent by-elections is the graph with some (apparently random) vote share figures included. At least those figures are unsourced EG
Brent East
http://tinyurl.com/ypwqrz
Projected figures 41:37:13 – actual 34:39:16
Hodge Hill
http://tinyurl.com/2m3dl4
Projected figures 39:37:13
Actual 36:34:17
Hartlepool
http://tinyurl.com/37voyv
Projected 40:40:20 –
actual 40:34:10
Ealing Southall
http://tinyurl.com/2rzvf4
Projected 37:31:22
Actual 41:28:22
The end result of that road is this:
Bromley
http://tinyurl.com/2mebnp
No figures even given – just bars.
Seems to me that we did there exactly what we’re complaining about Labour using here – or at the very least it’s a debate I’m not sure we should be highlighting!
Seats where Lab are first, Lib Dem second and Conservatives distant third
Rochdale: Lab 41% Lib Dem 41% Con 10%
Oxford East: Lab 36% Lib Dem 35% Con 17%
Edinburgh South: Lab 33% Lib Dem 32% Con 24%
Hampstead and Kilburn: Lab 36% Lib Dem 35% Con 23%
Islington South and Finsbury: Lab 40% Lib Dem 38% Con 15%
Aberdeen South: Lab 37% Lib Dem 33% Con 17%
Edinburgh North and Leith: Lab 34% Lib Dem 29% Con 19%
All of those seats would produce that bar chart.
Except, Hywel, that all those figures you quote are pretty close to the final result.
Bearing in mind that people’s views can and do change as polling day approaches, you could hardly expect them all to be identical – but they are all pretty on the ball, particularly in reporting correctly who the election race was between. If you want dodgy bar-charts from those elections, take a look at some of the other parties’ leaflets.
But what’s the source of those figures Mark?
If they are independent sources then why not say so? If they are informed guesses then why don’t we say so – and state what the basis for the guess is.
How was Hartlepool ever going to be close to the actual result? That would have required UKIP etc to poll 0%
Why is the Bromley one acceptable and this Labour one not.
Again though we are defending our actions by reference to them being better than the other parties. (a) that’s not hard and (b) we should aspire to better than that if we are to be serious about rebuilding trust with the electorate.
Though none of this detracts from the fact that if Labour are circulating graphs like that in Lib Dem/Labour marginals it’s a deeply bad tactical decision for them to be taking.
I posted the whole leaflet on my blog a couple of weeks ago.
It is hillarious, but had all my neighbours saying to me: “Is the vote so close in Swindon?”
I replied yes of course – please vote Lib Dem at the next election.
I have already secrued five poster sites in my road!!
woops… hyperlink did not work above, here it is again.
http://twgr.blogspot.com/2007/09/labours-leaflet-of-lies-on-crime.html
Jeezus Mark – Isn’t the whole point of the bar chart debate is that Labour and Tory think that it’s the big lie that allows Lib Dems to win when we all know it’s about who has the best crayons?